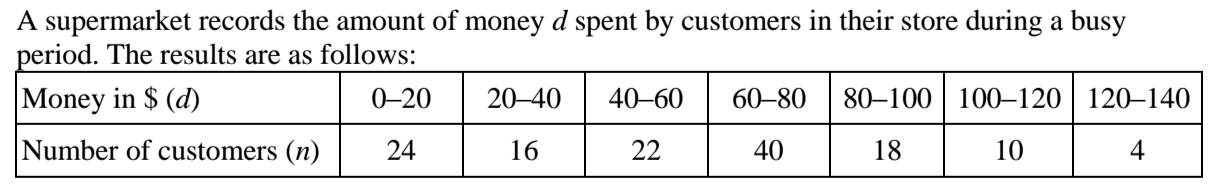
 Explain and demonstrate how to use the TI-84 to find the estimated mean here. Explain how to find the value that represents each group interval to make the calculation. 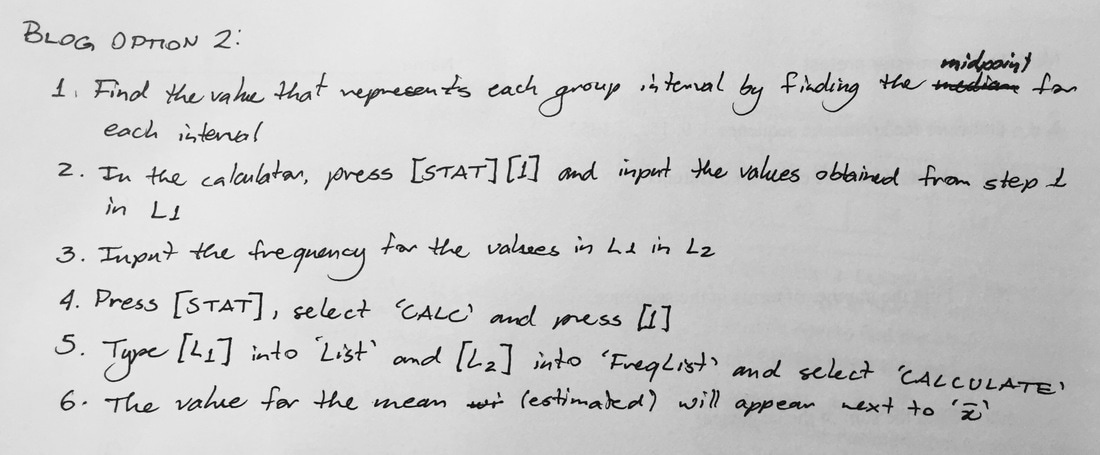  2  3  4  5  6
0 Comments
 Explain and demonstrate finding the critical dollar value corresponding to 37 minutes, then the graphical procedure used to find the number of customer who stay more than 37 minutes by annotating the cumulative frequency graph appropriately.    Explain and demonstrate the graphical procedure to find Q1, Q3, and the median by annotating the cumulative frequency graph appropriately. Then show how these values, and the given min/max, are used to construct the boxplot.  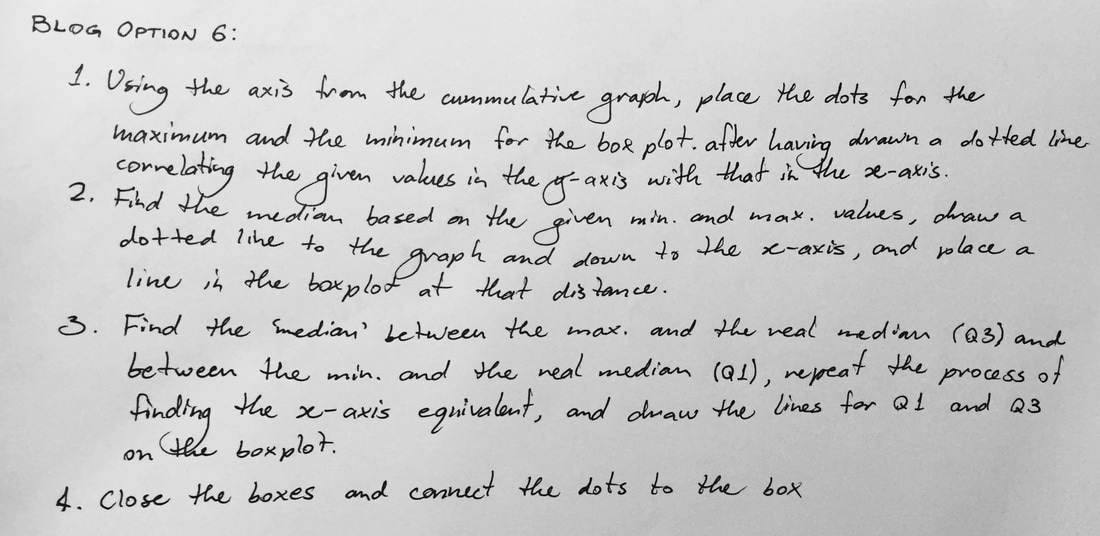  |
-
Blog Options
- Chapter 1: Quadratics >
- Chapter 2: Functions >
- Chapter 3: Exponentials >
- Chapter 4: Logarithms >
- Chapter 5: Transforming Functions >
- Chapter 6: Sequences and Series >
- Chapter 7: Binomial Expansion >
- Chapter 8: Unit Circle and Radian Measure >
- Chapter 9: Non-right Triangles >
- Chapter 10: Trigonometric Functions >
- Chapter 11: Trigonometric Equations and Identities >
- Chapter 12: Vectors >
- Chapter 14: Intro to Differential Calculus >
- Chapter 15: Rules of Differentiation >
- Chapter 16: Properties of Curves >
- Chapter 17: Applications of Differential Calculus >
- Chapter 18: Integration >
- Chapter 19: Applications of Integration
- Chapter 20: Descriptive Statistics
- Formula Booklet
- About
