|
Using the graph of f‘, explain how to determine where are the stationary points of f, and what are their classifications. Roughly sketch the function f, based on the signs of the gradients at x=p, q, and r, and the regions x<p and x>r. The x-axis of your sketch should have p, q, and r marked on it. 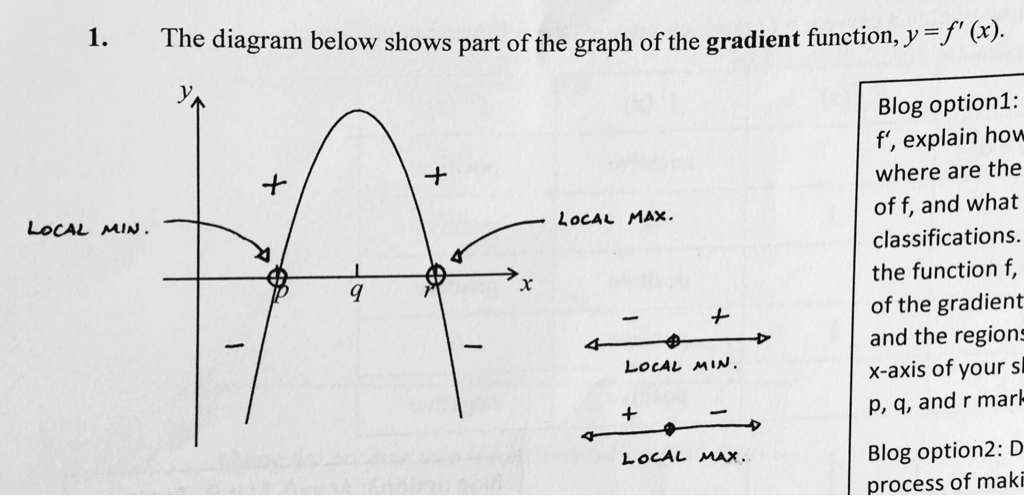 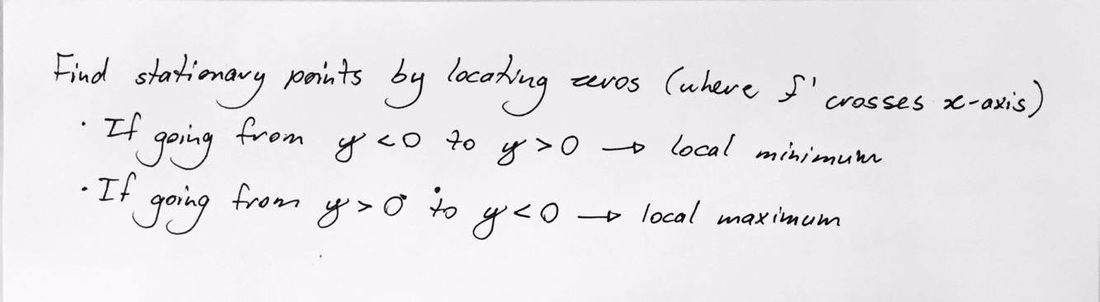 
0 Comments
|
ArchivesCategories |
-
Blog Options
- Chapter 1: Quadratics >
- Chapter 2: Functions >
- Chapter 3: Exponentials >
- Chapter 4: Logarithms >
- Chapter 5: Transforming Functions >
- Chapter 6: Sequences and Series >
- Chapter 7: Binomial Expansion >
- Chapter 8: Unit Circle and Radian Measure >
- Chapter 9: Non-right Triangles >
- Chapter 10: Trigonometric Functions >
- Chapter 11: Trigonometric Equations and Identities >
- Chapter 12: Vectors >
- Chapter 14: Intro to Differential Calculus >
- Chapter 15: Rules of Differentiation >
- Chapter 16: Properties of Curves >
- Chapter 17: Applications of Differential Calculus >
- Chapter 18: Integration >
- Chapter 19: Applications of Integration
- Chapter 20: Descriptive Statistics
- Formula Booklet
- About
 RSS Feed
